One of the great things about working openly is that is leads to all sorts of serendipitous collaborative opportunities. Last week we had a lovely example of that when we were able share a joint creative twitter challenge between our online event #GCUGamesOn and the latest iteration of #BYOD4L.
Friday was the final day of #BYOD4L and the focus of the day was on creating. We thought it would be fun to get participants to share a sporty/keep fit photo and provide a way to be creative and have some Friday fun. As both our online events are very flexible it really only took a quick skype call to add this activity to both.
Sue has collated the responses in to this storify.
The #BYOD4l & #GCUGamesOn Creative Challenge Storify
I have written a short piece for ALT’s online newsletter about my experiences on both sides of their Learning Technologist of the Year award. The full article is available here. And here is a version of it, with a photo that somehow got missed out in the article.
One of the highlights of last year for me was winning ALT’s individual Learning Technologist of the Year Award. As a winner I’ve also been part of the judging panel for this year’s awards. In this post I’m going to try and share some of my thoughts from both sides of the competition fence.
Martin Weller has recently written a blog post about awards in which he captures how many, myself included, feel about awards:
“I’ve never been one for awards really. My view has been that the people who get them tend to be the people who least deserve them, often because the people who deserve them are too busy doing the actual stuff to bother chasing awards”
But as Martin acknowledges, after winning an award things do change. He then goes on to highlights some of the benefits of winning awards.
“1)They act as a shortcut – instead of explaining why something/someone is doing a good job you can just say ‘award-winning’.
2) It helps – we have researchers on the project and this may help get further funding to keep them, or enable them to get other jobs. Being sniffy about awards seems churlish then.
3) It felt nice – it’s not all about the altruism I’ll admit, it felt kinda nice to be given an award, even if I couldn’t be there to collect it.”
Never having really won anything in my life, I was totally thrilled to win the ALT award. Not least due to the fact that it was recognition from my peers. The timing was almost perfect for me too as it coincided with a major change in my career. It was a really lovely bookend to my time working at Cetis. It also helped when I was starting in my new job as it was something quite impressive to put in my staff bio. I now also have something in the awards section in LinkedIn, which previously I never really understood the point of:-)
Winning is one thing, but as they say, “you’ve go to be in it to win it”. Entering competitions is daunting and time consuming. One of the reasons I really enjoy working in the learning technology community is the lovely people in it. Those I most admire tend to be the most modest about their achievements and contributions. However this is not a good thing when it comes to entering the ALT Learning Technologist of the Year Award. This is where you really need to forget modesty and take the opportunity to share and celebrate your achievements. At this point I should need to confess that I didn’t actually write my own entry. My colleagues Lorna Campbell and Christina Smart conspired, took the time to fill out the form, and then told me when they had sent off the entry form. That gesture in itself meant a huge amount to me too.
Being part of this year’s judging panel has given me another perspective on the awards and the selection process. After an initial sifting to ensure entries meet all the entry requirements, the completed written entries are judged using a relatively simple but clear marking process. The top scoring entries from that process are then invited to an interview, where they are asked to do a short presentation and then answer some set questions, which are again scored by all the judges. Once all the shortlisted entries have been seen, the decisions are made about the winners.
After a very long but very enjoyable day going through this process recently I have some tips for those of you who maybe think about entering but never get round to it.
Don’t just think about it, enter the competition.
Do think about entering a colleague(s) (with or without telling them)
Don’t leave it till the closing date to write your entry.
Don’t assume that judges will understand your context, explain with specific, easily understood examples and evidence what you have done/ are doing. Highlight student /staff engagement and feedback.
Don’t be modest. If you are selected for an interview you have already proved that you are doing outstanding work, so take the opportunity to celebrate it, yourself and your contribution to the community.
Do be incredibly proud of being shortlisted – the competition is tough, particularly this year.
You never know, you too could have blue paper signs left in your wake!
Another week, another workshop on learning analytics. This time hosted by Blackboard, in the University of Salford’s rather fabulously shiny MediaCity building in Manchester.
As GCU is a Bb customer we are obvioulsy exploring the Blackboard Analytics solution, however yesterday wasn’t just a sales pitch, a large part of the day was given over to discussion and finding out what “our” priorities are. It isn’t lost on Bb colleagues that many of their case studies are from North America, so although of interest are very skewed the priorities of the educational system there.
Retention is of course high on everyone’s list, but I’m more interested in seeing how, and if, learning analytics can help make improvements in the wider student experience. We seem to be obsessed with the bottom 20% and top 5% (Nb these are just made up numbers) but what about the forgotten middle who make up the majority of our student population? Improving their educational experience is probably more important isn’t it? Aren’t they the ones who are the key to getting all our NSS scores up?
Although many people are interested in learning analytics, getting started is quite difficult. Not least because it’s difficult to know where to start. Last week at #cetis14, we were looking at creating an institutional learning analytics policy, and I think everyone there agreed that senior management support was vital. In some ways, yesterday was more about bottom up approaches /needs, but again senior management buy-in was identified as key for any developments.However, it is crucial that everyone, including senior management, do understand the implications of taking a more data driven approach. Developing data literacy has to be part and parcel of any learning analytics work
During our discussions, the notion of “academic embarrassment” came up as a possible barrier to adoption. This was said in the context of sometimes work/projects being blocked because someone (perhaps quite senior) doesn’t understand the full implications of that piece of work, and often doesn’t (a) admit that they don’t know what everyone else is talking about , and/or (b) take/ or have the time to find out. This little doodle of mine seem to strike a chord with a few folk on twitter.
The Blackboard product does offer a lot, but of course at a price. But any serious work on analytics will have time and cost implications. Identifying and selling those internally is the tough bit for many of us. The Bb product (and indeed, any analytics product/package) is just part of the overall solution. However as I’m discovering just starting the conversations with some key stakeholders such as Information Services is a great way of starting new collaborations.
We have now officially completed our HEA Challenges of Web Residency Project, and submitted our case study on Friday.
This post is really just a collection of what we have shared so far and a link to a draft version of the case study we submitted to the HEA on Friday. Things didn’t go quite as planned, particularly around getting student engagement, however we are still working with the V&R model, and in fact did a workshop with some undergraduate students yesterday afternoon. The case study explains in more detail our experiences and reflections of the project, as ever I’d be interested in your thoughts/experiences.
Earlier this week I went to London with my colleague Evelyn McElhinney to join the rest of the projects in the HEA Challenges of Web Residency Programme. As I’ve written about before this programme is exploring students use of online spaces using David Whites visitor and residents mapping methodology.
In terms of our project, we have only managed to run one workshop. There are various reasons for this, but mainly around timing, it took a bit longer to get ethics approval and then lots of our undergrad nurses were on placement when we planned our workshops.we are going to run some more between now and the summer.
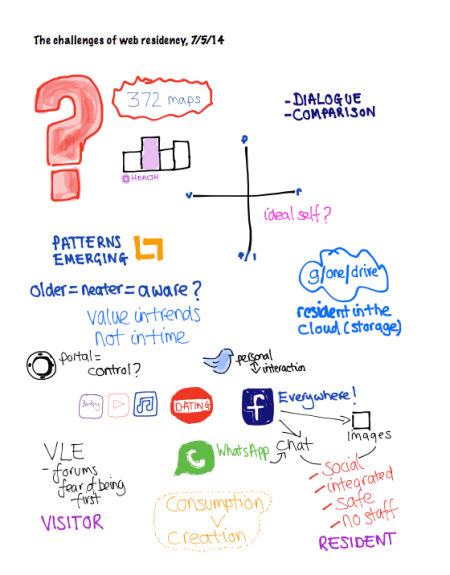
I was “well impressed” by some of the projects who have managed to get between 80-150 maps. It was also fascinating to see the overlay images David has managed to pull together. There were a few L shape patterns in the grid appearing. However, as David acknowledged it is hard to draw any concrete conclusions, and context is crucial. So it was good to hear in a bit more detail from some of the projects about their experiences and conclusions. Once common theme was that students did value their own online spaces for collaboration and didn’t want “us” there.
Once again I’ve been experimenting with visual note taking on my ipad and here is my note of the feedback session (clicking on the picture will take you to original image).
workshop notes
In terms of our experience, our participants were Post Registered Health Care professionals, so they are working full time and attending uni. Unsurprisingly the are pretty strategic in the visitor and resident engagement. They have also found ways to circumvent professional barriers (e.g. quite closed networked systems) that prevent them accessing what they find as useful services such youtube. We’ll be writing up our case study over the next fews days so I’ll be able to share more then.
I’m a bit late in getting this post out, but as those of you who follow me on twitter will know, I was at the Blackboard Teaching and Learning Conference in Dublin last week. It’s the first Bb conference I’ve been to and I have to say I found it really enjoyable. It was great to meet finally meet in person twitter buddies @sharonlflynn and @hopkinsdavid, and get to know some more of the Bb European community.
There does seem to be a genuine shift in emphasis from Blackboard towards developing more customer led and informed “solutions” in new releases of the system. The Bb staff are also being very supportive in terms of helping us (and others) investigate some of our more strategic issues around TEL. However it is sometimes the simple things that make the most difference, so like many others I gave a small cheer as we saw the long wanted (and needed) student preview capability. Other changes that will make a big difference to users included dragging and dropping artefacts into portfolios, improved assessment and feedback capabilities such as easy set up multiple marker roles, anonymous submission handling and searching. Unfortunately the much nicer interface showed in Jay Bhatt’s keynote is still “under development” but hopefully we’ll get that, and responsive design in the not too distant future. I’m also really thinking about templates and how we can revamp our installation over the summer as we move to the next upgrade.
Bb really do seem to be taking notice of there international market, and as Jay Bhatt put it, not be “a US company that happens to sell in other countries”. Still not sure if “countrification” is a word, or a very good way of describing this 🙂
Inspired by the fabulous sketchnotes from David Hopkins, I’ve also started to play around with more visual note taking (well it’s actually more like quite bad handwriting and some doodles on my ipad). So here is the visual view of my highlights from the conference.
It’s not been the best week for women in IT. Early In the week we learned that Julie Ann Horvath quit Github due to allegations of harassment. Any story like this saddens me. I have generally had positive experiences of working in IT, but I have been in many situations where I am one of a few women in a sea of men. I also have had that feeling that I have been judged and my capabilities underestimated due to the colour of my hair. Equally I have, and continue, to work with some fantastically supportive male colleagues. And I am I now working somewhere with a very high proportion of female senior staff which shouldn’t be something I feel need to comment on, it should be normal. But sadly it isn’t.
Over the past two years former Australian PM Julia Gillard was subjected to what I can only describe as horrific misogyny. However as many of you know she did make a quite wonderful speech in Parliament in 2012. Today I spotted via BoingBoing that this has now been set to music. I’m not sure if it is as powerful as the original speech, which still gets me standing up and cheering “go Julia” whenever I see/hear it, but I found the overview from the composer of the piece Rob Davidson very thoughtful.
“The resulting choral piece, in which the singers echo and support the Prime Minister’s speech melodies, is initially quite humorous, as we are confronted with the melody that perhaps was not evident to us before. As the music goes on, it passes into something more serious, and (it is hoped) we hear the Prime Minister as a woman experiencing very real emotions.”
Enjoy – and I am humming, “not now, not ever” as I type
Despite the best intentions of the weather this week, a number of people from around the UK managed to make it to London on Wednesday for workshop as of the HEA Digital Literacies in the Disciplines programme. As I blogged about before, the main focus of our case study will be within nursing programmes in our school of Health and Life Sciences.
The workshop was primarily an opportunity to bring the projects together and for us all to get a more in depth overview of the background to the mapping process. For me the clarification of the ends of the V and R scale in terms of social traces was really useful. Visitor behaviour is where you don’t leave a social trace online and residency is where you interact with others and leave a social trace. The bit in the middle is where you are online to be with people, but within a known group e.g. Facebook.
I liked David White’s use of the term “elegant lurking” e.g. a student who follows experts in a certain field on twitter but doesn’t interact with them, but does get a lot of useful information through the wider interaction of that group of people. As someone who isn’t keen at all on the term lurking this contextualization really appealed.
As with most mapping exercises it is a not an exact science and the dialogue generated by undertaking the exercise is the most interesting part of the process. We were shown a range of different maps (again really useful to see) and as with most maps they all sparked a range of questions for me.
One of the reasons we are keen on this methodology for nursing students is so we can provide a way for them to articulate and understand where and how they interact online in context of their professional, personal and student identities. Hopefully this will allow us to improve how we support them in developing relevant professional and personal practice. We are also interested in wider issues of where and how they use different social spaces for learning. Will they even think to add our VLE to their maps?
This links to the use and support of learning spaces at an institutional level. Do we really need to be investing in developing social sharing spaces within our institutions (e.g. Yammer) when most students use services such as Facebook anyway? And if we try to use these more personal spaces in a formal educational context, will that just make the students move somewhere else where they want to be? We may always be playing catch up. In turn, if these institutional social spaces are relatively closed will they be of any future value to students? Should we be focusing attention on helping our students use recognised professional spaces such as Linked-In and leave them to use other online spaces in an informal way?
I found the mapping exercise fascinating, and it’s really made me think about where and how I exist and leave social traces online. I thought I had a good overview of my online interactions – particularly in a professional context. But seeing other maps, and talking with people on Wednesday I remembered a whole lot of spaces where I do have a large social trace but I had actually forgotten about. Like many people I have “played” around with online bio services such as about.me, but I kind of forget about them as they are automagically updated from RSS feeds from my more active and engaged spaces such as my blog and twitter. However I’ve had over 3,500 visits to my about.me page in the past year which astonished me. I also have a vizify page which again is populated from other services. It has what I always thought was a good overview of ‘where I am” online
Vizify online places
But after doing the mapping exercise I think picture is more like this
Sheila’s V&R map, Feb 2014
I confess I’ve had to re-do my paper map from Wednesday as I had forgotten quite a few things, and also I wanted to use circles not rectangles. Don’t think it makes any difference but there are a few Venn like overlaps. I was also impressed by fellow delegate who used powerpoint on Wednesday to create his map.
We are running our workshop next month and I’m really looking forward to the maps and discussions it generates.
How do you measure success on a MOOC? It’s a question that has been causing a lot of consternation as our traditional measures of success in education don’t seem to apply. Large drop out rates, challenges of assessment at scale, I don’t really need to go into all the details, it’s documented by others far more eloquently than me.
However, despite my unsuccessful attempts in many MOOCs I have managed to complete a few (4 now!). They all have been successful learning experiences for me. I got a certificate for one of them, but nice as they spacemen are on it, it isn’t really my biggest signal of success. As I blogged about before, it’s been after the MOOC that the really collaboration and reflection on success has begun.
This week at the EMOOCs 2014 Conference my colleagues Paige Cuff and Helen Crump are presenting our paper Signals of Success. Now having a paper accepted for a conference might not be your measure of success for a MOOC, but for me, Paige, Helen, Penny, Briar, Iwona and Yishay, actually pulling of this international collaboration has been a real triumph.
You can see a pre-print of our paper and some more information here.
And if you are wondering where the title of this post came from, this twitter conversation will give you a clue.